FOOD SAFETY INSIGHTS
By Bob Ferguson
Food Safety Insights: 5 Years Later, Part 1
Celebrating the Food Safety Insights partnership with Food Safety Magazine
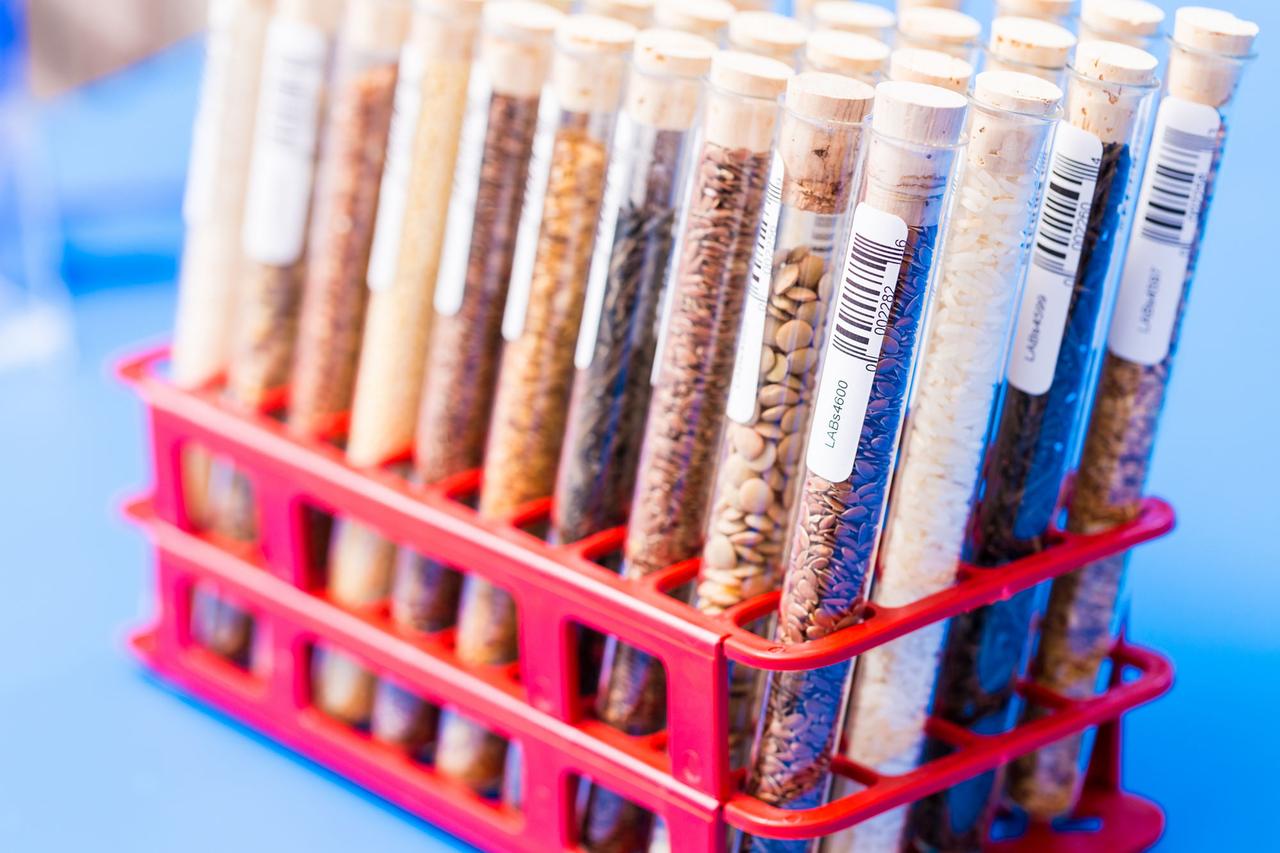
Photo credit: luchschen/iStock / Getty Images Plus via Getty Images
SCROLL DOWN
Food Safety Insights was first published in Food Safety Magazine in the February/March 2017 issue. So, even though we have two more columns left in 2021 (October/November 2021 and December 2021/January 2022), I thought I would take this opportunity to celebrate 5 years of Food Safety Insights columns and look at some of the highlights of what we have covered and the changes we have seen since that inaugural column.
Growth of the Testing Market
In the first column in 2017, we reported that the global food safety microbiology testing market accounted for 1.14 billion total tests, up from 966 million tests in 2013 (and 738 million tests in 2008). Since then, we have chronicled the steady growth in this market to our current estimates of nearly 1.4 billion tests in 2021.
These tests are largely in two categories—indicator tests for things such as total viable organisms, coliform/Escherichia coli, yeast/mold, and other nonpathogens generally used for overall process monitoring and quality indicators—and pathogen tests, to detect Salmonella, Listeria, E. coli, and other pathogens for environmental monitoring and end-product testing. In 2017, indicator-organism tests accounted for approximately 860 million tests, or 75.4 percent of all microbiology tests conducted, up from 742 million tests, 76.8 percent of all tests performed in 2013. Pathogen tests in 2017 were estimated at 280 million tests, or 24.6 percent of total microbiology test volume, versus 224 million tests, or 23.2 percent, in 2013, accounting for 7.7 percent growth (compound annual growth rate, or CAGR).
In 2021, we estimate that globally, indicator tests will account for approximately 1.1 billion tests, or 74.3 percent of total tests, and pathogens will number around 380 million, or 25.7 percent, showing a 5-year CAGR of 5.6 percent for indicator tests and 7.6 percent for pathogen tests over the course of these past 5 years, and a total CAGR for microbiology of 6.3 percent.
So long as processors continue to grow, add capacity, and expand internationally, this global increase will continue. Many developing regions will be a strong driver of this growth as consumers in those countries continue to shift to eating more processed foods. And as processors continue to innovate and develop new types of processed and convenience foods—especially in categories like ready-to-eat, takeout meals, and meal kits (which have zero-tolerance standards)—global growth in testing will remain strong.
“And as processors continue to innovate and develop new types of processed and convenience foods…global growth in testing will remain strong.”


Growth of Listeria Testing
We see that the growth in pathogen testing is the fastest-growing part of microbiology testing, but the trend is not uniform across the category. Over the past 5 years, we have seen a clear acceleration in the growth rate for Listeria testing. In 2018, testing for Listeria accounted for 130 million tests. In 2021, this volume is estimated to grow to more than 160 million tests, making Listeria the highest-volume pathogen test.
Much of this increase in volume has been driven by a higher focus on environmental monitoring and the realization that Listeria is present and persistent in more plant areas than previously recognized. Plants seeing recurring Listeria contamination events increased their environmental monitoring and instituted more “seek and destroy” projects to remove harborage organisms and find and eradicate the source of Listeria.
Whole-Genome Sequencing
One area where we did not see any change in historic data was in the use of whole-genome sequencing (WGS) by food processors. We have asked the question about the use of WGS in every year of Food Safety Insights, and, for the fifth straight year, very few processors report using WGS for any of their samples. As shown in Figure 1, in the surveys we have completed, we found that less than 10 percent of all survey respondents reported using WGS even once. Processors responded to our questions with comments such as “have not seen the necessity to use WGS,” or “WGS is too complicated for any use that we need,” “we have low incidence of positive samples, and we have no need for further sophisticated confirmation,” or “WGS is too expensive.”
Now, this does not mean that use of WGS has not grown significantly—it has. WGS has transformed how we see and track outbreaks and has become a valuable tool for regulatory agencies such as the U.S. Food and Drug Administration (FDA) and the U.S. Centers for Disease Control and Prevention (CDC). FDA’s change in policy in 2017 to start collecting swab samples during inspections and submitting them for WGS analysis certainly drove interest in the technology. This was followed by CDC’s use of WGS during outbreak investigations and fully converting to the use of WGS in 2019 for their PulseNet laboratories. These changes added to demand for WGS analysis. But food processors—not regulatory agencies—represent the largest potential source of demand for WGS, and by and large, they have used the technology only sparingly for incident response, source identification, and similar projects, but not on an ongoing basis as part of their regular testing.
This will be an area of the market that will continue to merit a close watch. If the price of WGS can come down to a level that matches the utility of the technology for processors, or as next-generation sequencing applications show greater speed and value to processors, this category may show potential for greater growth.
FIGURE 1. Do You Analyze Any Samples for Whole-Genome Sequencing?
Outsourcing to Laboratories
The outsourcing of sample analysis to commercial food laboratories is another strong market trend that we have watched grow rapidly over these past 5 years. It has been especially strong in the analysis of food pathogens. In recent years, however, we have seen accelerated outsourcing of analysis of nonpathogenic indicator organisms as well.
As we have previously reported, processors are reluctant to work with pathogens in their in-plant labs out of a concern for the risk of introducing these organisms into their plant. Therefore, processors outsource these samples to commercial labs at higher expense to reduce risk. This phenomenon generally holds true until the volume of tests demanded is sufficiently large that the economic benefit of in-house analysis outweighs the cost of mitigation of the risk of accidental contamination. This inflection point, however, is not typically at the cost break-even point, but companies are willing to pay 20 percent or more for outsourced analysis than they would for in-house analysis in exchange for the reduction in risk. The risk is the key decision criterion, not finances.
What may be surprising to many is the increasing growth in outsourcing of the less risky nonpathogen tests. I like to call this “sample dragging,” or to put it very simply, if processors are going to send most of their pathogen samples to outside commercial labs, it becomes easier to just send more of the others, too. And as the volume of analysis done in the in-plant lab falls, there is less justification to maintain an in-house lab at all, further accelerating the outsourcing trend.
This outsourcing phenomenon is strongest in the U.S. and Canada and lowest in Asia. Outsourcing in Europe closely mimics what we see in the U.S. and Canada, although with a higher level of sample analysis remaining at in-plant labs. In our interviews, this divergence is attributed largely to differences in labor laws across regions. In the U.S. and Canada, processors tend to run their labs with fewer employees than their counterparts in Europe. They also report that it is easier for them to “let lab staff go” once the in-house lab is not seen as a core competency but one that is not providing a service that is safer to outsource. European companies certainly recognize these same issues, but European labor laws make it much more difficult and expensive to eliminate staff. This changes the decision criteria for European companies, and hence, they tend to keep their in-house analytical staff longer than do their North American counterparts.
Nonetheless, this outsourcing phenomenon will continue to drive growth in the commercial laboratory market. When we model this demand for commercial laboratory services and include a forecast for this additional outsourced sample volume plus only moderate price increases over the next 2–3 years, we project that commercial lab market value growth in food safety microbiology testing and analysis will probably exceed 10–12 percent annually. This will be evident in the further growth in the number of lab locations, especially for the already large major players, and a corresponding increase in mergers and acquisitions, consolidation, and investment activity in this market.
In part 2, we will continue this review and discuss other issues we have covered, including the Food Safety Modernization Act, COVID-19, and supply chains and examine more of the issues we have found and some we’ll be watching in the future. Look for that Food Safety Insights in the October/November 2021 issue of Food Safety Magazine.
Bob Ferguson is president of Strategic Consulting Inc. and can be reached at bobferguson9806@gmail.com or on Twitter at @SCI_Ferguson.
