SCROLL DOWN
Predictive Modeling for Food Safety and Quality of Meat Products
When determining shelf life for meat products, the use of predictive modeling can help prevent spoilage and preserve freshness
By Lene Meinert, Director Food Safety; Anette Granly Koch, Technical Manager Food Safety; and Gry Carl Terrell, Senior Consultant Food Safety, Danish Meat Research Institute (DMRI), Danish Technological Institute
Video credit: shironosov/Creatas Video+ / Getty Images Plus via Getty Images
> SPOTLIGHT
When meat products are sold, shelf life is an important competitive element. Shelf life depends on several factors, of which the most important are production hygiene and storage temperature, as well as the amount of preservation in the meat product—i.e., pH, salt, nitrite, and organic acids. When determining shelf life, it is important to consider how the growth of both spoilage organisms and pathogenic bacteria can be prevented while at the same time keeping a keen eye on the sensory quality of the product.
The growth of pathogenic bacteria can be estimated by mathematical models available on the web—i.e., ComBase’s www.combase.cc or the DMRI’s www.dmripredict.dk. These models can easily establish how much preservation should be added to a product to prevent the growth of various pathogens, such as Listeria monocytogenes and Clostridium botulinum, during the desired shelf life at a given temperature.
It is also important to pay attention to preventing the growth of spoilers which, in some cases, may require a higher level of preservation than what is needed to prevent the growth of pathogens. An example is the growth of lactic acid bacteria, which will need more preservation to inhibit than what is needed to prevent the growth of L. monocytogenes. Thus, creating the correct formulation of a product to prevent the growth of microorganisms and predict the shelf life in which the product is both safe and fresh is a highly complex task. Predictive modeling has proven to be a valuable tool in solving this task.
A Historical Perspective
The first seeds for what we now know as predictive modeling of microbial growth were planted in the 1920s when W.D. Bigelow, Chief Chemist at the National Canners’ Association, used the famous Arrhenius Equation to describe the logarithmic nature of thermal death time curves.1 Bigelow was interested in describing the heat destruction of spores to calculate the time needed to heat treat cans to prevent outgrowth of C. botulinum spores and ensure the safety of canned food.
In the 1980s and early 1990s, major food poisoning events (e.g., 1985: L. monocytogenes in Mexican-style soft cheeses from Jalisco Products Inc. and 1992: Escherichia coli O157:H7 in beef patties from the Jack In The Box restaurant chain), combined with the trend of eating more fresh food, drove the predictive microbiology more toward predicting the growth of vegetative cells of an array of traditional and emerging microorganisms—not only pathogens, but also spoilage bacteria. This development was strongly aided by the increasing availability and calculating power of computers, which grew rapidly from the early 1990s. Major events involving foodborne pathogens also turned the attention of governments and legal entities worldwide to food safety and related issues.
With this increased focus on food safety followed a steep increase in the financing of research. In the 1990s, the rapid microbial methods were still in their infancy and did not provide answers as quickly as the market required. Hence, a significant drive arose for alternative methods of determining and documenting whether a food product was safe and could remain fresh through the distribution chain. All of these factors, plus the massive R&D to support the theories of being able to predict microbial growth, eventually led to the acceptance of predictive microbial modeling by legislators around the world. Today, predictive modeling is generally accepted as part of the validation step in HACCP and is used extensively in both microbial risk analysis and product development in the food industry.
“Like many other sectors, the meat and poultry industry has faced unprecedented disruption from the COVID-19 pandemic.”


Shelf Life Models
The shelf life of meat depends on several variables and is the overall sum of microbial growth and lipid oxidation. It is important to note that determining shelf life is not an exact science, and it is somewhat impossible to take all variables into account when predicting shelf life. The authors’ organization has investigated which of these factors are the most important.
Shelf Life Models – Fresh Meat
Through the execution of different shelf life pre-trials, it became clear that prediction of shelf life for fresh meat can be covered by three factors: 1) temperature, 2) method of packaging, and 3) bacteria count at the time of packaging. Furthermore, the trials showed that the best indicator of spoilage is odor. The shelf life models were developed based on this gained knowledge and decades of experience in the meat industry. The aim was (and still is) to develop predictive tools for the meat industry that cover the most important real-life variation, rather than explaining the observations “to a molecular level.”
The fresh meat models are based on data from shelf life trials, which were conducted following a standardized procedure:
- Collecting meat at the slaughterhouse (on the day after slaughter); the meat was predominantly packed at the slaughterhouse before transport
- Transporting the meat to the authors’ organization, followed by refrigerated storage (temperature loggers were applied to ensure that the cold chain was unbroken)
- Upon arrival, 15 samples were opened and analyzed (bacterial plate count and odor assessment were carried out by an expert sensory panel)
- At intervals throughout the trial, five samples were randomly selected from the refrigerated storage and analyzed (psychrotrophic bacterial count and odor assessment were carried out by an expert sensory panel)
- The trial stopped once the meat was completely spoiled, meaning that the odor assessment average scored the meat to be unacceptable.
Meat cuts were randomly collected over time at commercial plants in four countries. The categories of meat collected included cuts (pork, beef, and chicken) and minced (pork and beef).
During the initial trials and data analysis, it was observed that the bacterial count at the time of packaging was related to odor development. Therefore, the model outputs are the growth of bacteria (psychrotrophic count) over time and odor development over time. The minimum period of time the models can handle is one day. Due to the natural variations between single cuts, modeling growth (shelf life) for periods of less than one day would not be useful.
The microbiological growth curves and the sensory evaluations of the raw meat odor were fitted using nonlinear regression2 with the Baranyi and Roberts growth model3 (Figure 1).
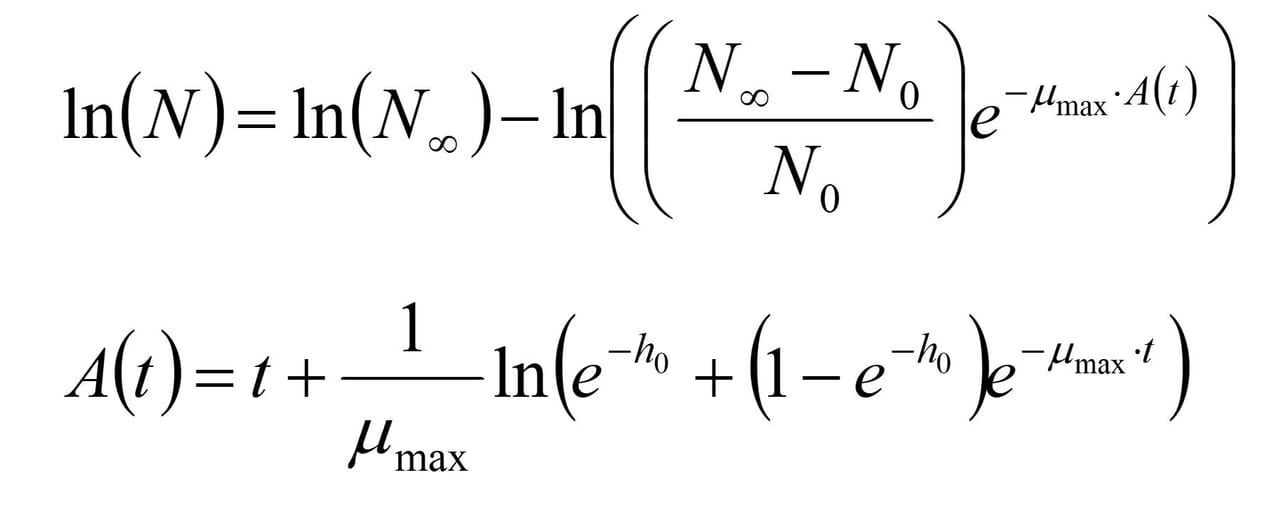
FIGURE 1. The Baranyi and Roberts Model3
The parameter h0, which corresponds to the lag phase, was independent of temperature and packaging method, but the lag phase for the development of odor showed dependency on the initial psychrotrophic colony count. Growth curves from different studies were compared using proprietary software to extract growth parameters from challenge test data.4,5
Pork Cuts Model Combines Different Temperature and Packaging Conditions
Often, meat undergoes changing temperature and packaging conditions throughout the distribution chain, from the production site until it reaches the consumer. To predict a total shelf life while accounting for these variations, the possibility was investigated of combining the models for the three packaging methods: vacuum, aerobic (wrap), and modified atmosphere (MAP). All three models were developed separately, using the described standard procedure.
To validate whether the models could be combined, several experiments were conducted, during which the storage conditions were changed for a subgroup of samples. It was important to investigate and validate the actual response to changes, especially regarding bacterial growth—would the growth slow, or would it increase? The answer was neither. The growth continued by following the established curve for the new storage condition.5
Shelf Life Model – Bacon
A model for predicting the shelf life of bacon was developed, using the same principles as for fresh meat.
Shelf Life Model – Processed Meat
The shelf life of processed (i.e., cooked) meat products depends on temperature and packaging method, just as is the case for fresh meat, but also on the preservation profile. Data collection for the processed meat product model followed the standard procedure used for the fresh meat models. Again, the samples (cold cuts) were collected randomly over time from commercial plants in four countries, thereby ensuring that the data material would cover a broad variation of cold cut types, preservation, and production conditions. The preservation profile of the products varied from 1–3 percent salt, 0–150 ppm nitrite, and 0–2 percent sodium lactate. The storage temperatures varied from 2–8 °C. The model is based on data from 37 trial series in which approximately 2,000 packages of cold cuts were analyzed for psychrotrophic and lactic acid bacteria. Furthermore, approximately 10,000 sensory assessments of the appearance, odor, and flavor of the cold cuts were conducted.
The data analysis to develop the processed meat model was more complex than the analysis used for the fresh meat models, partly due to a higher number of variables in the processed meat model. The processed meat model was developed in collaboration with statisticians at the Danish Technological University. Several models were tested on the data, and the best fit was observed with a so-called logistic model (in R: SSlogis) in the version shown in Figure 2.
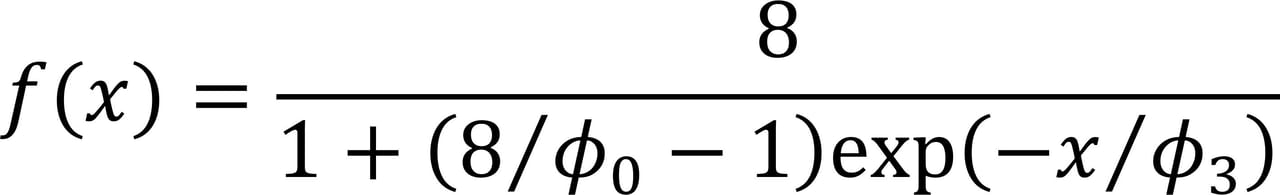
FIGURE 2. The Logistic Model Used for the Processed Meat Model
Safety Models
Predictive models are useful tools for validating the microbial safety of food products. Many predictive models are available in literature and online. Some are free to use, and others require a membership. In general, models are developed based on growth studies of microorganisms. Some models are based on growth studies in the laboratory, where different concentrations of preservatives are added to growth substrates and stored at a defined temperature range. Other models are developed based on challenge tests in food products, where products are manufactured with different combinations of preservatives, inoculated with microorganisms, packed, and stored at relevant temperatures.
When choosing a predictive model to validate a recipe or process, it is extremely important to make sure that as many of the parameters affecting survival, inactivation, or growth of the microbes in question are included in the model as possible. The more parameters the model misses, the poorer the prediction. Thus, if a product with pH 5 is produced by adding salt, sorbate, and lactate, then all of these compounds must be included in the model; otherwise, the result will use more preservative than needed.
The authors’ organization has developed a range of models describing the inactivation, survival, and growth of pathogenic bacteria in meat products. All of these models are based on challenge tests of meat products, and the parameters are chosen in dialogue with the Scandinavian meat industry. The models presently include:
- L. monocytogenes: Growth of L. monocytogenes in meat products (deli type)
- C. botulinum: Growth/no growth of C. botulinum in meat products (deli type)
- ConFerm: Survival/reduction/growth of L. monocytogenes, Shiga toxin-producing E. coli (STEC), and Salmonella during the production of fermented and matured sausages
- Yersinia enterocolitica: Reduction of Y. enterocolitica during production of salami
- Y. enterocolitica: Growth/reduction of Y. enterocolitica during curing of meat
- Staphtox predictor: Predicts Staphylococcus enterotoxin formation and the increase in the numbers of S. aureus during mild heat treatment or fermentation of meat
- Safety of dried meat products: Growth/reduction of L. monocytogenes, STEC, and Salmonella during production of dry cured meat.
Safety Models – L. monocytogenes and C. botulinum
Examples of predicted growth of L. monocytogenes and C. botulinum are shown in Figure 3. The growth model for L. monocytogenes is based on data from growth studies in different cooked, sliced, and modified atmosphere (MA)-packaged deli meats inoculated to simulate recontamination during slicing and packaging.6,7 A five-strain cocktail of L. monocytogenes was grown in brain heart infusion (BHI) broth with 2 percent NaCl at 10 °C for two weeks to simulate recontamination with strains adapted to the cold environment in meat processing departments.
The cooked deli meats were produced with different combinations of pH, NaCl, nitrite, lactate, and acetate. Storage conditions varied with temperatures ranging from 2–12 °C and different concentrations of CO2 in the packaging gas. The model was generated using a neural network that calculates the specific growth rate of L. monocytogenes in relation to the values of the seven variables included in the model and was subsequently validated using a large dataset (N = 156). The bias and accuracy factor were calculated to be 1.06 and 1.51, respectively.8 The results indicate that the model can be categorized as “good,” which is the highest category.
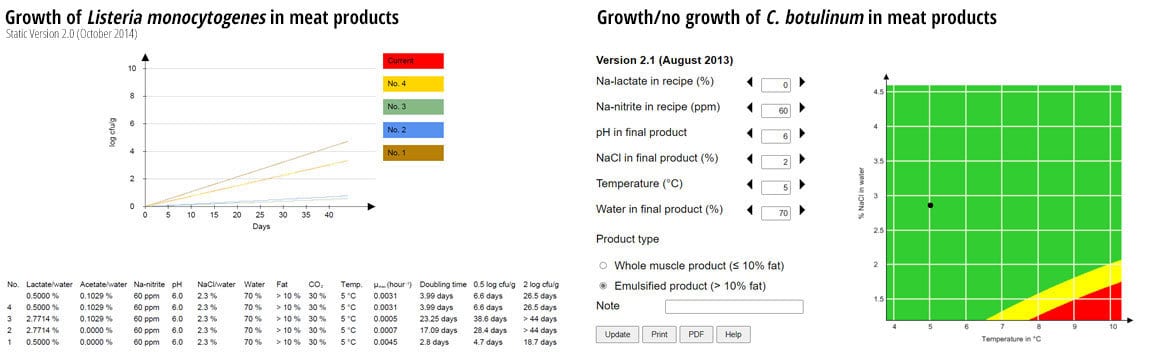
FIGURE 3. Growth of L. monocytogenes and C. botulinum in Meat Products with Different Concentrations of Added Preservatives, MA-packaged, and Stored at 5 °C
The neurotoxin produced by C. botulinum is so dangerous that looking at growth rates is not useful. To maintain a high level of food safety in products where C. botulinum spores have not been inactivated (e.g., by heat treatment), only products preserved to completely prevent growth are acceptable. Therefore, a growth/no growth model was developed, describing the risk of growth of C. botulinum. The model for C. botulinum is based on data from growth studies using a four-strain cocktail of psychrotrophic, non-toxin-producing C. botulinum spores, surviving heat treatment (72°C core temperature, holding time 10 min). The four strains were initially shown to be similar to toxin-producing strains with respect to growth at low temperatures and heat resistance (D90°C = 0.5–4.4 min).
The meat products were produced with different pH and concentrations of salt, nitrite, and lactate. After heating, the meat products were sliced and packaged in modified atmosphere (30 percent CO2/70 percent N2). When a prediction is placed in the green area (the black dot in Figure 3), a safe product has been produced. In the green area, the risk of growth is considered “low” (P ≤ 0.00025). If the dot is placed in the yellow area, then the risk of growth is considered “average” (0.00025 < P < 0.001), calling for caution. Adding slightly more preservative might be needed to produce a safe product. If the black dot is placed in the red area, then the risk of growth is considered “high” (P ≥ 0.001), and more preservative must be added to make the product safe (or, alternatively, the shelf life must be limited to 10 days at cold storage).
To validate the model, results from challenge tests of different meat products with varying manufacturing and packaging conditions, in a total of 60 combinations, were used. Combinations showing growth after four weeks of storage received the value 1, and combinations showing no growth received the value 0 (“observed probability for growth”). These values were compared to the “expected probabilities for growth,” as returned by the model for the input values corresponding to the 60 combinations. “Expected probabilities for growth” values were converted to the statements for growth mentioned above. The observed and calculated probabilities for growth were compared, and bias (error) was calculated. A positive bias (average error) means that the probability for growth is over-estimated (“fail safe”), whereas a negative bias means that the probability for growth is under-estimated (“fail dangerous”). The bias of the model was calculated to 0.0166 and was “fail safe,” meaning that the model, on average, predicts slightly higher probability for growth than observed in the data.
Safety Model – ConFerm
The reduction of pathogens during production of typical North European fermented sausage is shown in Figure 4. The recipe input includes 3 percent NaCl, 100 ppm nitrite, and 25 percent weight loss; fermentation at 24 °C for two days, and drying at 16 °C for 16 days. Total reductions for L. monocytogenes: 1.3 log CFU/g ± 0.5; total reductions for Salmonella: 2.6 log CFU/g ± 0.7; total reductions for STEC: 2.1 log CFU/g ± 0.6.
The DMRI’s ConFerm model is based on data from studies where survival, reduction, and growth of a cocktail of Salmonella (four strains), STEC (three strains) and L. monocytogenes (five strains) was measured during the production of fermented and matured sausages (diameter: 60–100 mm) at a drying temperature of 16 °C and 85–90 percent relative humidity (RH).9 The models are based on 73 experiments comprising sausages with different pH decreases, nitrite and water phase salt (WPS) content in the mince. The model variables are fermentation temperature (°C), salt/water (percent), nitrite added (ppm), pH in mince (pHstart), pH after fermentation (pH48h), and pH in the final product (pHfinal) in relation to process time (days) and weight loss (percent) during drying. To obtain different pH values in the sausages, three starter cultures with different fermentation efficiencies (T-SPX Bactoferm, F-1 Bactoferm, and F-SC-111 Bactoferm) were used. Fermentation was performed in a climate cabinet at, for example, 24 °C for two days with 90–95 percent RH. After two days of fermentation, the sausages were matured at 85–90 percent RH at decreasing temperatures to 16 °C, until the desired weight loss was achieved. During the first five days, the sausages were smoked twice, using beech chips.
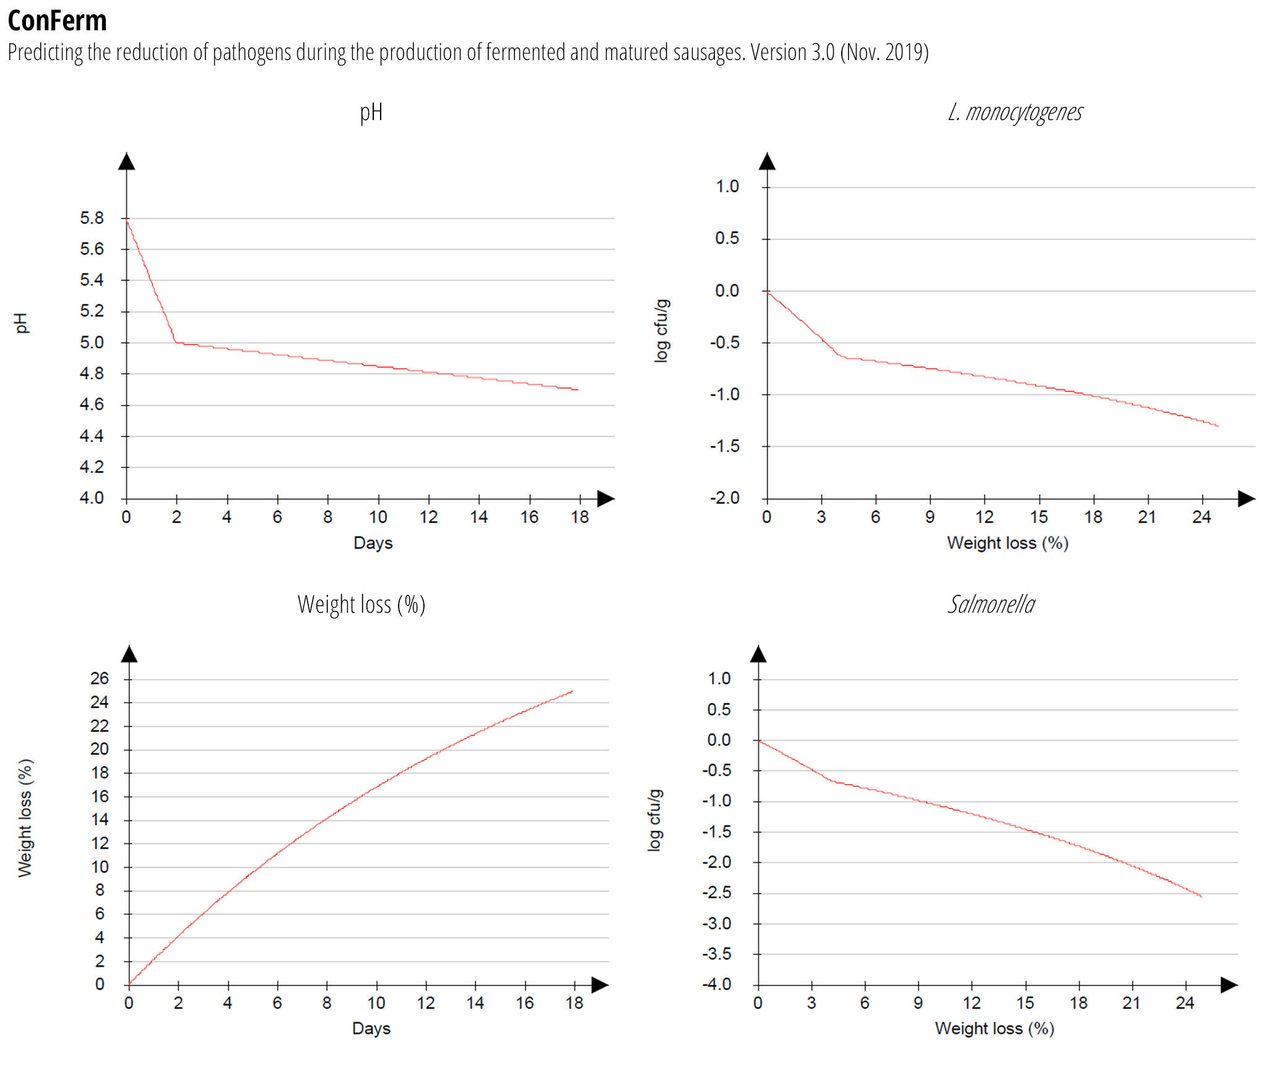
FIGURE 4. Reduction of Pathogens During Production of Fermented Sausages
A linear regression technique was used to develop models for predicting the reduction of L. monocytogenes, Salmonella, and STEC, respectively. The models were validated with 19 new recipes produced in the same way as described above. The 19 recipes varied with two levels of fat (approximately 10 percent and 15 percent in the mince), giving two levels of WPS (4.5 percent and 5.0 percent) in the mince, and nitrite levels were in the range of 60–150 ppm. In the validation data set, the starter cultures were supplemented with Bitec LS 25.
For Salmonella, the bias and accuracy factors were calculated to be 1.02 and 1.15, respectively, indicating that the model, on average, overpredicts the reduction by 2% (corresponding to a slightly “fail dangerous” model). For the STEC model, the bias and accuracy factors were calculated to be 0.99 and 1.20 respectively, indicating a slightly “fail safe” model. For the L. monocytogenes model, the bias factor was 0.99, which is the optimal value. The accuracy factor is 1.27, which is the same level as that for the STEC model. The three reduction models (Version 2.0, released June 2016) tend to under-predict, on average, with 10% when the concentration of NaCl added to the mince is ≥ 2.8%. The predicted value for bacterial reduction is given as an average ± standard deviation.
Future Perspectives on Predictive Modeling in Food Safety
With the intense focus on food safety and, in recent years, the recognition of food waste as a serious factor in addressing both the shelf life of food products and climate change, there is no doubt that the use of predictive modeling will increase. Much product development is in the pipeline to create more sustainable meat products (e.g., by adding vegetables or legumes to the recipes) and a growing familiarity with (and acceptance of) the use of predictive tools.
The range of available models is increasing correspondingly as data is gathered and processed. The authors’ organization is working to add two more models in the near future. One model will help predict the shelf life of plucks (liver, kidneys, diaphragm), and the other will help predict the growth of gas-producing lactic acid bacteria in processed meat products, which can lead to “blown” packaging. All models are free and publicly accessible for registered users.10 Models will continue to be added based on the need (as identified in the meat industry) and the available funding.
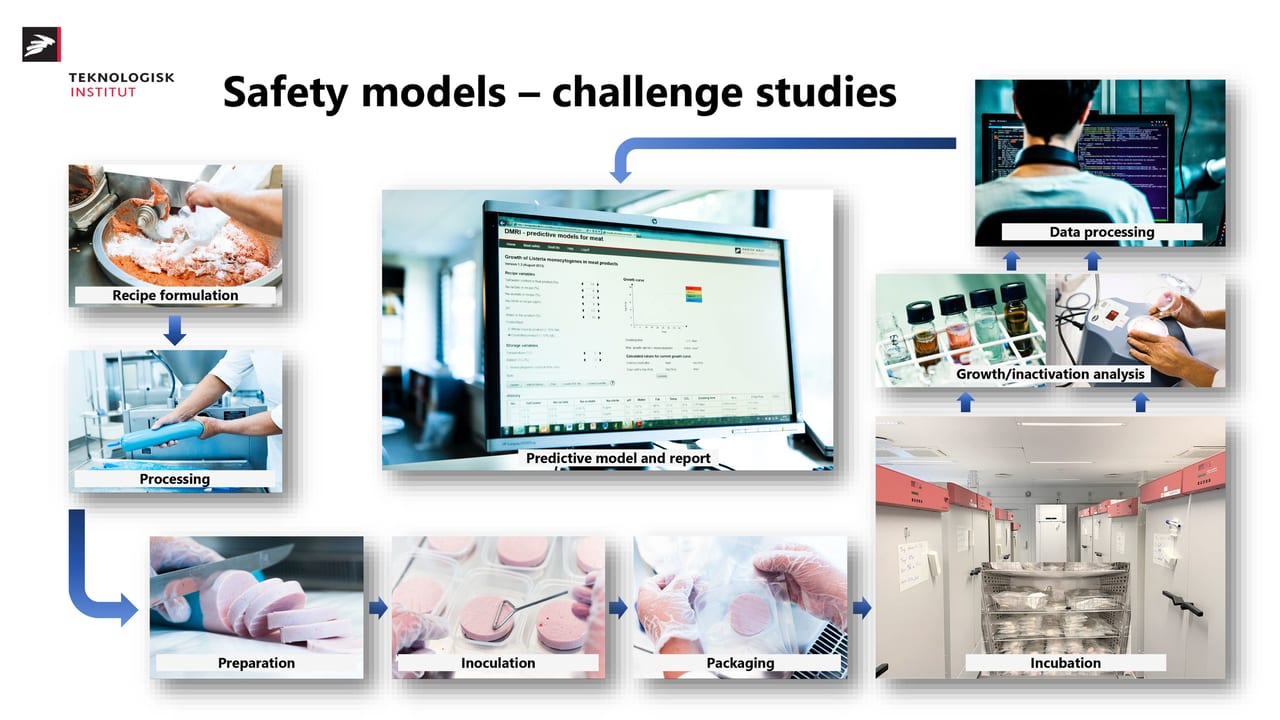
FIGURE 5. Future Perspectives on Predictive Modeling in Food Safety
Acknowledgements
The model development has been conducted over several years with financial support from funds, companies, and R&D programs, including: the Danish Pig Levy Fund; the Danish Poultry Production Levy Fund; the Danish Cattle Levy Fund; Meat and Livestock Australia (MLA); Nortura, Norway; HKScan, Sweden; Green Development and Demonstration Program (GUDP Denmark); the Danish Environmental Protection Agency under the Ministry of Environment of Denmark; and the Danish Agency for Higher Education and Science under the Ministry of Higher Education and Science Denmark.
Resources
- Bigelow, W.D. 1921. “The logarithmic nature of thermal death time curves.” The Journal of Infectious Diseases. 29(5): 528–536. https://doi.org/10.1093/infdis/29.5.528.
- SAS 9.1.3 Service Pack 4, Proc Nlin. SAS Institute Inc., Cary, North Carolina, U.S.
- Baranyi, J. and T.A. Roberts. 1994. “A dynamic approach to predicting bacterial growth in food.” International Journal of Food Microbiology. 23(3–4): 277-294. https://doi.org/10.1016/0168-1605(94)90157-0.
- MicroFit v1.0 software from the Institute of Food Research.
- Meinert, L. and H. Christensen. 2014. “DMRI Predict, a tool to determine shelf life of fresh meat.” Proceedings of the 60th International Congress of Meat Science and Technology. Aug. 17–22, Punta Del Este, Uruguay. http://icomst-proceedings.helsinki.fi/index.php?year=2014.
- Gunvig, A., J. Blom-Hanssen, T. Jacobsen, F. Hansen, and C. Borggaard. 2007. “A predictive model for growth of Listeria monocytogenes in meat products with seven different hurdle variables.” Proceedings of the 5th International Conference Predictive modeling in Foods. Sep. 16–19, Athens, Greece.
- Mejlholm, O., A. Gunvig, C. Borggaard, J. Blom-Hanssen, L. Mellefort, T. Ross, F. Leroi, T. Else, D. Visser and P. Dalgaard. 2010. “Predicting growth rates and growth boundary of L. monocytogenes – An international validation study with focus on processed and ready-to-eat meat and seafood.” International Journal of Food Microbiology. 141(3): 137–150. https://doi.org/10.1016/j.ijfoodmicro.2010.04.026.
- Gunvig, A., F. Hansen, and C. Borggaard. 2013. “A mathematical model for predicting growth/no growth of psychrotrophic C. botulinum in meat products with five variables.” Food Control. 29(2): 309–331. https://doi.org/DOI:10.1016/J.FOODCONT.2012.06.046.
- Gunvig, A., C. Borggaard, F. Hansen, T.B. Hansen, and S. Aabo. 2016. “ConFerm – A tool to predict reduction of pathogens during production of fermented and matured sausages.” Food Control, 67: 9–17. https://doi.org/10.1016/j.foodcont.2016.02.026.
- Danish Meat Research Institute. “Predictive models for meat.” www.DMRIpredict.dk.
Lene Meinert is the Director of Food Safety for the Danish Technological Institute. Lene has an M.Sc. degree and a Ph.D. in food science, and has for years worked in the field intersecting food microbiology, food chemistry, and sensory science.
Anette Granly Koch has an M.Sc. degree in food science and a Ph.D. in microbiology. She works with research and development and consultancy for the food industry focusing on food safety, hygiene, and shelf life (food spoilage).
Gry Carl Terrell has an M.Sc. degree in food science and technology with emphasis on microbiology, food safety, and spoilage. Gry has diverse work experience from the food manufacturing and analytical industry in the U.S. and Denmark.
