WHOLE-GENOME SEQUENCING
By Peter Gerner-Smidt, M.D., D.Sc.
Whole-Genome Sequencing for Food Safety
Just what is whole-genome sequencing, and how can it be used to improve food safety?

Photo credit: Tetiana Lazunova/iStock / Getty Images Plus via Getty Images
SCROLL DOWN
Whole-genome sequencing (WGS) is one of the new buzzwords in food safety. This article is a brief review of what WGS is and how it has revolutionized food safety in recent years. It has now become an integral part of public health surveillance and is increasingly used by the food industry in the United States and abroad to study foodborne bacterial pathogens, indicator and spoilage organisms, and the spread of antimicrobial resistance, virulence, and more. WGS in food safety has particularly focused on bacteria (the subject of this article), but it is equally efficient to use with viruses and parasites.
A Little Background
WGS determines the full genetic makeup of a cell—the “genome,” which consists of the chromosome and extrachromosomal elements, such as plasmids. Both are circular structures, but chromosomes are much bigger [1–6 million DNA base pairs (bp)] than plasmids (~500–a few hundred thousand bp). For many years, it was only possible to sequence short stretches of DNA up to a few thousand bp, but around 2000, it became possible to determine the whole genomic sequence by sequencing it many times in small, overlapping random pieces (~25–several thousand bp) in one reaction (massive parallel sequencing). These millions of overlapping sequences can then be aligned to each other like puzzle pieces, thereby, in theory, establishing the full contiguous sequence of the genome. This assembly is done electronically using special bioinformatics software. Other bioinformatics software can then be used to compare assembled sequences from different bacteria. The bioinformatics software is available online for free in the public domain as well as in commercial packages. Commercial software is typically more user-friendly than open-source software but costly. The cost of software may be recovered if the analysis can be done by existing personnel without hiring bioinformaticians. The actual sequencing reaction is called next-generation sequencing (NGS), and the whole sequencing, assembly, and analysis process is WGS.
WGS Methodology
For practical purposes, two types of NGS exist: short-read sequencing and long-read sequencing, sometimes also called second- and third-generation sequencing, respectively, with several variants of each. The short-read sequencers are highly accurate, but as the name implies, the length of each stretch of sequence generated (a “read”) is short, typically 50–500 bp. With short-read technology, it is rarely possible to assemble a genome fully (“close the genome”) because the genome contains regions with repeated sequences that cannot be resolved with short reads. The long-read sequencers are less accurate but produce longer reads (~1,000–100,000 bp), and so it is often possible to close genomes with this technology. The sequence of a closed genome can often accurately be determined by correcting the errors in a closed genome generated with long-read technology by mapping the reads from the reliable short reads to it. The manufacturers produce multiple models to fit almost any laboratory’s needs, from handheld sequencers that may be used in field investigation to desktop models to large room-size sequencers. Sequencers cost anywhere from $1,000 for a handheld sequencer to several hundred thousand dollars for the biggest models. A small desktop model can be purchased for about $20,000. The cost of sequencing ranges from $50 to more than $1,000 per sample, depending on the sequencer and batching of samples.
It is evident that with a workflow as complex as WGS, a lot can go wrong; for that reason, quality control of the whole process is of utmost importance to ensure the generation of reliable data and analyses.
“It is evident that with a workflow as complex as WGS, a lot can go wrong; for that reason, quality control of the whole process is of utmost importance to ensure the generation of reliable data and analyses.”


WGS Applications
WGS is powerful in many ways. It is the ultimate tool to differentiate isolates from each other for surveillance, tracking of sources of outbreaks/contamination, or transmission routes. Phenotypic traits such as antimicrobial resistance, virulence, and serotype may be predicted from WGS. As a surveillance tool, WGS is more discriminatory than any other existing method. In public health, it has been increasingly used over the last decade, and in 2019 in the U.S., the technology replaced old high-discriminatory methods like pulsed-field gel electrophoresis (PFGE) to detect and investigate outbreaks of foodborne illness. Because it is more discriminatory than PFGE, more outbreaks are detected faster, often when they are small, and more outbreaks are investigated and solved. Despite its fairly high cost, the method is cost effective because it also replaces other routine strain characterizations such as serotyping, antimicrobial resistance, or virulence testing. In a recent case study of European and American public health laboratories, it was estimated that the implementation of WGS in the national surveillance of salmonellosis would pay for itself if, on average, 0.7 percent of reported cases could be prevented.1
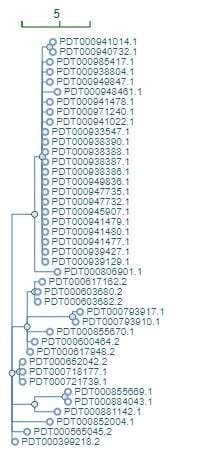
When comparing sequences of isolates for surveillance purposes, two fundamentally different approaches are used. The sequences are queried either for mutations at the DNA base level (single nucleotide polymorphisms—SNPs) or for any sequence variations in the genes (core genome multilocus sequence typing—cgMLST). The two methods are equally discriminatory and complement each other, which is why both are used to confirm each other’s results in outbreak investigations. It is difficult to standardize the SNP method between laboratories, whereas cgMLST can be easily standardized through the use of common databases. For this reason, SNP is best suited for centralized surveillance with one hub laboratory doing all the analyses. On the other hand, cgMLST is better suited for decentralized surveillance in a network of many laboratories like it is done today in PulseNet, the American molecular subtyping network for foodborne infection surveillance.2 The sequences are compared in a pairwise fashion by both methods, and their similarity is visualized in phylogenetic trees, which represent the evolutionary distance between isolates. Outbreaks appear as clustered isolates near the leaves of the tree that clearly are separated from other isolates elsewhere in the tree (Figure 1). It is usually not possible by looking at a tree to tell whether it is based on SNP or cgMLST analysis. WGS is so discriminatory that hardly two sequences are 100 percent identical, so outbreak-related isolates often show a few differences, typically up to 5–10 SNPs or gene variations (“alleles” in cgMLST), but with large variations depending on the organism involved and the outbreak circumstances. For example, outbreaks caused by Salmonella Enteritidis typically show little variation (up to 2–3 SNPs/allele differences), whereas outbreaks caused by S. Typhimurium typically show variations within the 5–10 SNP/allele difference range.2,3 Such a tight range of differences is typical for point-source outbreaks that result from a contaminated food from a single source in a single event, like a single batch of food. More variations up to 50 SNPs/alleles may be seen in zoonotic outbreaks where the infection is transmitted through contact with animals or outbreaks resulting from person-to-person spread.4 Persistent outbreaks that result from the release of contaminated food from its source over a long time, such as at a production plant with a resident strain that evolves during production, also often show substantial variations between the outbreak-related isolates.
FIGURE 1. Phylogenetic SNP tree of sequences of 41 clinical isolates of Shiga toxin-producing Escherichia coli O157. The SNP differences are represented by the depth of the horizontal lines from one isolate to another using the scale in the top left corner. The 23 sequences on the top cluster tightly at fewer than 5 SNP differences and could represent an outbreak. The data were pulled from the GenomeTrakr database using the Pathogen Detection pipeline (https://www.ncbi.nlm.nih.gov/pathogens/).
However, resident strains do not always evolve rapidly in a production environment, and there are instances where an outbreak strain hardly evolved over many years. Thus, it is impossible to establish firm criteria that define all outbreaks. Nevertheless, it is possible to define inclusion criteria for almost any outbreak. To detect outbreaks, public health scientists typically look for clusters of isolates that differ from each other in the 5–10 SNP/allele range that are clearly separated from all other isolates. As the investigation progresses, a threshold that uniquely defines that outbreak is determined. It must always be kept in mind that in an outbreak investigation, genetic similarity between isolates, a biologic measure, is an imperfect proxy for epidemiological relationships, and for that reason, sequence analysis alone cannot solve an outbreak. A WGS match between a food and a clinical isolate cannot alone prove that the food caused the illness of the patient. Epidemiological and/or traceback and environmental investigations must be conducted to solve an outbreak before regulatory action can be taken. It is also important to keep in mind that an outbreak may be solved without detecting the outbreak strain in any food source. In point-source outbreaks, it is not uncommon for the outbreak strain to have disappeared from the production environment, with no food remaining from the implicated batch when the source is determined.
In Public Health
WGS has expanded the outbreak signals to which public health agencies react. Matching a food isolate to a few clinical isolates not uncommonly identifies the source of an outbreak when it is detected. Such “retrospective” or “vehicle-driven” outbreak investigations have become much more common of late.2 In the past with PFGE, epidemiological follow-up on a link between a food isolate and a few patient isolates usually disproved an association between the two. The extremely high specificity of WGS compared with PFGE has changed that. However, even with WGS, such links are not uncommonly disproven. As mentioned earlier, finding the same strain in food and patients means they share a recent common ancestor. Epidemiologically, they may be unrelated because they belong to different divergence/distribution chains from that common ancestor. A different way WGS has changed outbreak investigations is that it is now possible to recognize persistent outbreaks with a small number of cases happening every year, the “low and slow” outbreaks.4 These outbreaks are real, and they are important to investigate and solve because, as with any outbreak, important food production lessons may be learned.
Interpretation of outbreak data is an expert task that requires careful consideration of all available information from WGS, epidemiological, traceback, and environmental investigations.
Besides outbreak investigations, routinely sequencing all patient isolates of foodborne pathogens provides public health scientists with other important information. Because the antimicrobial resistance of the isolates can be predicted by WGS, we now get that information on all isolates investigated in a public health laboratory, thereby not just enabling fast recognition of emerging resistance traits in patients and food sources nationally and globally but also adding a new level of detail to resistance surveillance. Resistance to, for example, penicillins and cephalosporins may be caused by numerous different mechanisms, some of which can be transferred between organisms; the exact mechanism(s) that cause the resistance and whether it is transferable can be predicted from WGS. Similarly, information about virulence genes may help scientists recognize the spread of virulent strains before this becomes clinically recognizable. Our knowledge about what makes particular strains virulent is incompletely understood. Knowledge about the content of potential virulence genes in foodborne bacteria will shed light on this in years to come. By comparing sequences of isolates from food, feed, and production environments, it is possible to identify genetic markers such as phylogenetic lineages, SNPs, genes, and gene functions, which are specific for different food commodities. This information can be compared with sequences of human isolates and thereby identify the major sources of sporadic infections at the food-commodity level (“microbiological attribution”). This is a powerful tool that is increasingly used to identify intervention areas in food production that most likely will drive down the incidence of foodborne illness.
“Interpretation of outbreak data is an expert task that requires careful consideration of all available information from WGS, epidemiological, traceback, and environmental investigations.”
In the Food Plant
In the industry, WGS is currently first and foremost used as a tool to accurately trace the introduction and transmission chains of pathogens and spoilage organisms in food production. When used for production monitoring, it is also a powerful tool to determine whether persistent contamination is a result of continuing independent sporadic introductions (the isolates have different WGS profiles) or reintroduction or persistence of a single strain in the production (the isolates show little WGS variation). This kind of information is critical to identify and assess microbiological quality issues in food production, guide their mitigation, and document their effects. This will in turn lead to production of safer food for the individual manufacturer and, if the information is shared more broadly, for the whole industry.
Information related to the adaptation and survival of pathogens and spoilage organisms in the production environment, including their resistance to biocides and metals, can also be predicted from WGS. This information can also guide food safety interventions by both industry and regulators.
WGS is one of the most powerful tools a food manufacturer has to clear its products from being the cause of an outbreak. If used as part of a food safety management program, WGS will, because of its superior specificity compared with older methods, convincingly rule out the producer as the source of an outbreak if the outbreak WGS profile is not found on its premises or products.
Where We Are Now
WGS is now implemented by public health and food safety authorities in the U.S. and in many industrialized countries throughout the world. It is also increasingly used by the food industry, even though a full sequence and analysis infrastructure has been established by only a few big companies. However, smaller producers may also use the technology in a cost-efficient manner.
Depending on their needs, WGS activities can be established at a lower-capacity level using small sequencers; with a fast Internet connection, data can be analyzed with little bioinformatics expertise using commercial applications or free software in the public domain. The activities can also be fully or partly outsourced to commercial partners. Private partners can only compare the sequences of the isolates they’re given with others in their possession and those available in public domain, that is, in the GenomeTrakr databases at the National Center for Biotechnology Information.2,3 However, two initiatives in the U.S. available to the industry may offer access to information about industry isolates’ relation to historic or ongoing potential outbreak investigations. The Institute for Food Safety & Health’s High-Throughput Sequencing Initiative, hosted by the Illinois Institute of Technology, and VoluntaryNet, hosted by the Center for Food Safety at the University of Georgia, offer state-of-the-art sequencing and analysis services to the food industry. Both initiatives have advisory boards with representation from industry and federal food safety partners; however, neither shares its industry data with its federal partners without specific permission. VoluntaryNet has direct access to the PulseNet database and may use all the tools available to the PulseNet partners, including isolate level-specific information about sequences from ongoing outbreak investigations not yet available to the public.
A major drawback of WGS is that it is performed on cultured organisms. Diagnostics are increasingly done using molecular methods without culture, and fewer isolates will be available for sequencing in the future. For that reason, work is progressing on obtaining isolate-level data without culturing by sequencing all DNA in a specimen (“metagenomics”).3 This work is in its infancy but shows promise as a tool that doesn’t just replace isolate-based sequencing but also documents the authenticity of food and the presence of unwanted contaminants and much more by gathering information about the microbial populations in people, animals, feed, food, and the environment.
References
https://www.eurosurveillance.org/content/10.2807/1560-7917.ES.2021.26.9.1900606.
Brown, E., et al. 2019. “Use of Whole-Genome Sequencing for Food Safety and Public Health in the United States.” Foodborne Pathog Dis 16(7): 441–450.
Jagadeesan, B., et al. 2019. “The Use of Next Generation Sequencing for Improving Food Safety: Translation into Practice.” Food Microbiol 79: 96–115.
Gerner-Smidt, P., et al. 2019. “Whole Genome Sequencing: Bridging One-Health Surveillance of Foodborne Diseases.” Front Public Health 7: 172.
Peter Gerner-Smidt, M.D., D.Sc., is a public health expert in food safety. He previously served as the chief of the Enteric Diseases Laboratory Branch and PulseNet at the U.S. Centers for Disease Control and Prevention.
