COVER STORY

Beyond the Audit Score: Transforming Restaurant Audits Into Risk Intelligence
The restaurant industry has an opportunity to change how it uses restaurant audit data to enable more foodborne illness risk intelligence
SCROLL DOWN
Video credit: Wavebreakmedia/Creatas Video+/Getty Images Plus via Getty Images
By Hal King, Ph.D., Managing Partner, Active Food Safety LLC
Foodservice companies now have access to more food safety data from restaurant operations than ever before. Third-party audits, regulatory inspections, internal assessments, temperature logs, corrective action records, customer complaints, employee illness reports, and in-restaurant digital monitoring systems now generate a continuous stream of information about restaurant food safety execution and performance.
Yet, in many enterprise foodservice businesses, these data are still reduced to a familiar set of outputs: an audit score, a list of critical violations, repeat findings, and quarterly trend reports. These tools remain necessary for verifying compliance with brand standards, franchise requirements, and the U.S. Food and Drug Administration's (FDA's) Food Code for health department compliance. However, these data are often siloed and not correlated for risk, and thus do not answer the more important public health and business questions: Which restaurants are most likely to cause illness? Which restaurants should be prioritized for focus and improvement to reduce the risk?
Moving to a Foodborne Illness Risk Intelligence Model
The opportunity for the restaurant industry is to change how it uses restaurant audit data to enable more foodborne illness risk intelligence. The next generation of audit data collection and analytics will probably look more like aviation safety models than traditional food safety audits. Airlines do not wait for crashes; they monitor:
- Near misses
- Equipment anomalies
- Weather
- Human performance
- Maintenance deviations.
Airlines also calculate risk continuously. Food safety management is moving toward the same architecture. The knowledge of what contributing factors lead to a foodborne illness outbreak in a restaurant can now be correlated to the large amounts of different data sources via artificial intelligence (AI) systems1 to better define actual risk. Instead of, "Restaurant number 001 scored 91 on the third-party audit," the risk intelligence model reports, "Restaurant number 001 has a 10-times elevated norovirus risk profile due to employee illness reporting patterns, handwashing failures, improper sanitizer use, employee turnover spike, and unresolved corrective actions during internal audits related to cleaning and sanitation of high-touch surfaces." A risk intelligence model would also answer the question, "What is the probability that this restaurant could cause illness in the next 30, 60, or 90 days?"
To develop a risk intelligence model, existing audit findings must be correlated with known foodborne illness risk factors logic. This can include mapping observations from receiving, storage, preparation, cooking, cooling, holding, employee health, sanitation, and food safety management system2 function to the known contributing factors that cause foodborne illness outbreaks. This risk intelligence model, when used with data from one restaurant, would integrate third-party audit findings with a number of other factors including:
- Health inspection history
- Employee illness data
- Staffing and turnover metrics
- Temperature monitoring
- Food-specific customer complaints
- Supply chain disruption or other issues
- Prior outbreak history
- Regional illness prevalence (e.g., norovirus outbreak in the same community)
- Other signals to produce hazard-specific risk scores (biological, chemical, or physical)
- Outbreak probability estimates
- Likely transmission pathways
- Recommended immediate preventive interventions.
In this model, the industry moves from retrospective compliance management to prospective public health risk management. The data would no longer simply show that a restaurant passed an audit; instead, it would reveal whether the combination of findings indicates an active contributing factor cluster pathway that requires intervention before customers become ill.
Evidence that inspection, surveillance, and consumer signal data can be used for foodborne illness risk prediction is not new. One of the earliest and most relevant studies was conducted in Seattle, Washington, where Irwin and colleagues3 evaluated whether routine restaurant inspection results could predict subsequent foodborne illness outbreaks. Using a matched case-control design, they compared restaurants associated with reported outbreaks to restaurants without reported outbreaks and found that case restaurants had significantly lower mean inspection scores than controls. More importantly, restaurants with poor inspection scores due to violations involving temperature control of potentially hazardous foods were substantially more likely to be associated with outbreaks. The study showed that routine inspection data were not merely administrative records; when properly analyzed for contributing factors, they contained predictive signals related to outbreak risk.
More recent work has expanded this concept by applying machine learning to foodborne illness surveillance and root cause. Wang and colleagues4 used foodborne illness case data from China's National Foodborne Disease Surveillance Reporting System to predict likely pathogens when laboratory testing was unavailable or incomplete. Their model used features such as geography, time of illness, patient age, symptoms, diagnosis, food name, and food type to classify root cause to pathogens including Salmonella, norovirus, E. coli, and Vibrio parahaemolyticus. The best-performing model, a gradient boosting decision tree, achieved approximately 69 percent accuracy. The significance of this work is not that machine learning replaced laboratory confirmation, but that it demonstrated how routinely collected epidemiologic data can be transformed into decision support when traditional confirmation methods are delayed, incomplete, or unavailable.
"The newest generation of food safety data analytics is now moving from prediction alone toward explainable, operationally useful risk intelligence."


Other studies have shown that risk intelligence can be created from data streams outside of traditional inspection and surveillance systems. Sadilek and colleagues5 developed FINDER, a machine-learned epidemiology system that used anonymized and aggregated web search and location data to identify restaurants associated with possible foodborne illness risk. The system calculated the proportion of people who visited a restaurant and later searched for terms suggestive of food poisoning. When deployed in Las Vegas, Nevada and Chicago, Illinois, restaurants identified by FINDER were more than three times as likely to be deemed unsafe during inspection as restaurants selected through existing methods. FINDER also demonstrated an important epidemiologic insight: in a substantial proportion of cases, the restaurant likely associated with foodborne illness risk was not the last restaurant visited by the majority of persons, illustrating why single-point third-party audit information alone may misattribute risk and why broader data integration can improve public health targeting.
The newest generation of food safety data analytics is now moving from prediction alone toward explainable, operationally useful risk intelligence. Sari and colleagues6 used New York State open inspection data to develop an explainable, transformer-based model for predicting food safety inspection grades from both structured data and unstructured deficiency narratives. By combining inspection metadata with narrative text from audits, and applying models such as RoBERTa, BERT, BiLSTM, and LightGBM, the study showed that inspection records contain meaningful descriptions of contributing factors as indicators of risk, including temperature abuse, pest infestation, unsanitary conditions, improper cooling, and other issues.
Starting with Foodservice Business Third-Party Audit Data
Taken together, these studies above establish the feasibility of a foodservice business using all relevant restaurant audit data that integrates relevant signals into a risk intelligence model. They can also correlate the data for each restaurant with known outbreak contributing factors into a practical tool for prevention. The restaurant third-party audit data should be the foundation for building this model.
Restaurant businesses—especially foodservice businesses with multiple owned or franchised locations—spend a great deal of money on third-party audits. These audits are often performed four or more times a year. Because the third-party auditing companies are trained well, often certified, and use the most current FDA Food Code in the audit design, they have significant experience with individual restaurant chains and their menus.
The data generated from these audits has the potential to reveal much more than grade, score, critical violations, and repeat violations. First, however, it is important to determine how the observations reported in third-party audits can be used to pinpoint foodborne illness outbreak pathways, rather than simply treated as isolated, single-point violations. In the author's opinion, it is best to start by correlating the contributing factors causing foodborne illness outbreaks to the third-party audit data. Then, determine which group of contributing factors in one restaurant creates a plausible sequence of events that could produce a foodborne illness outbreak.
Using Contributing Factors to Predict Restaurant Outbreak Pathways
The most recent report by the U.S. Centers for Disease Control and Prevention (CDC)7 on the analysis of foodborne illness outbreaks reported to the National Outbreak Reporting System (NORS), found that approximately 800 foodborne illness outbreaks occur in the U.S. each year, resulting in about 15,000 illnesses, 800 hospitalizations, and 20 deaths. This CDC analysis of foodborne illness outbreaks provides an important lens for interpreting restaurant audit findings. The central concept is the "contributing factor": the food preparation practice, employee behavior, or environmental condition that explains how an outbreak occurred. Contributing factors are not merely inspection violations. They are the operational failures that allow pathogens to enter food, grow to hazardous levels, or survive a control step that should have eliminated or reduced them.
CDC groups contributing factors (Table 1) into three outbreak pathway categories:
- Contamination occurs when pathogens or other hazards get into food
- Proliferation occurs when pathogens already present in food are allowed to grow or produce toxins, usually because of time and temperature abuse
- Survival occurs when pathogens remain in food because cooking, reheating, freezing, or another lethality step was inadequate.
This framework is useful because most restaurant outbreaks are not caused by one isolated mistake. They usually emerge when several failures align into a pathway: contamination occurs, growth is permitted, and the final kill step is absent, inadequate, or bypassed.
TABLE 1. CDC Contributing Factors for Foodborne Illness Outbreaks (Credit: H. King; adapted from CDC Restaurant Food Safety "Contributing Factor Definitions"8–11)
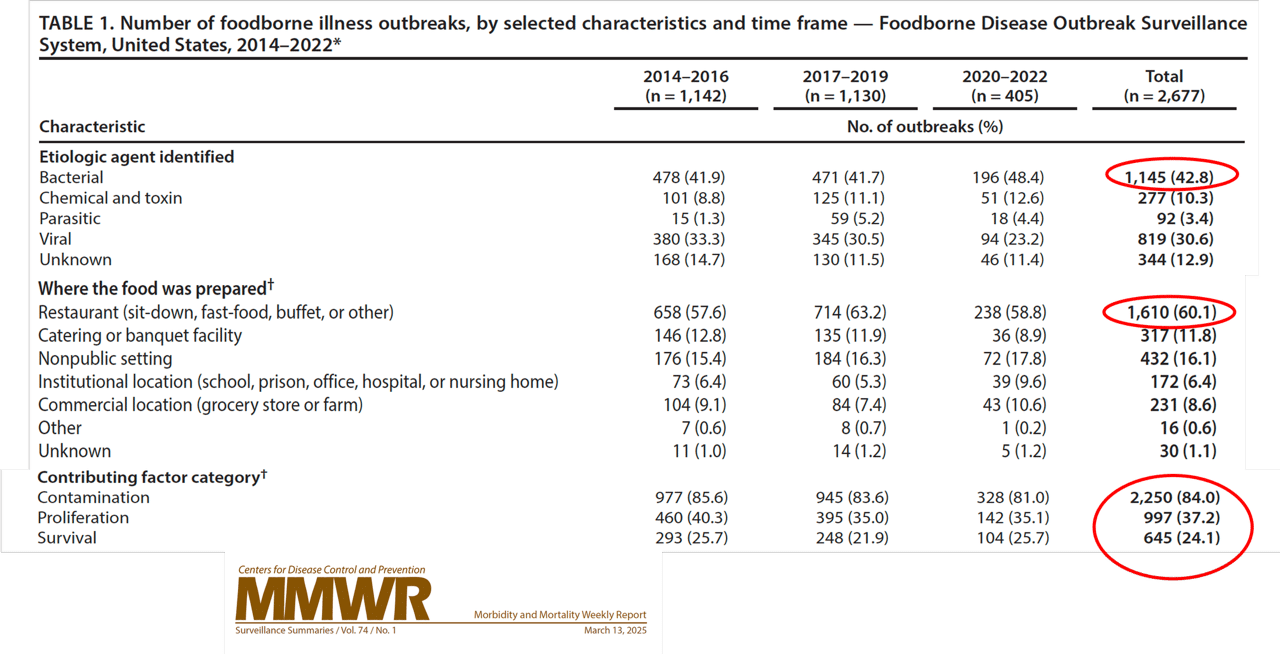
In a recent CDC study of 2,677 foodborne illness outbreaks that had contributing factor data, restaurants (Figure 1) were the dominant setting: food was prepared in restaurants in 60.1 percent of these outbreaks and eaten in restaurants in 53.4 percent. Across all settings, contamination was the most common contributing factor category, present in 84 percent of outbreaks. Proliferation was present in 37.2 percent, and survival in 24.1 percent. Because more than one contributing factor can be identified in the same outbreak, these categories should be read as overlapping pathway components rather than mutually exclusive causes.
FIGURE 1. Number of Foodborne Illness Outbreaks, by Selected Characteristics and Time Frame (Credit: CDC)
A common individual contributing factor was food contaminated by an animal or environmental source before arrival at final preparation, identified in 26 percent of outbreaks. This finding is particularly important for restaurants because it means that many outbreaks begin before the food enters the kitchen. However, the restaurant still determines whether that incoming hazard is controlled. A raw animal food, contaminated produce item, or contaminated ingredient becomes an outbreak risk when the operation fails to prevent cross-contamination, maintain temperature control, cook adequately, cool properly, or exclude ill employees.
The strongest risk predictive value of the CDC data is not in any single violation, but in the recurrence of high-risk clusters. For bacterial outbreaks, the most prominent pathway was contaminated food combined with failures in time/temperature control. Food contaminated before final preparation was the leading contributing factor in bacterial outbreaks across all three time frames reported, rising from 41.8 percent in 2014–2016 to 50.5 percent in 2020–2022. Other recurring bacterial outbreak contributing factors included food left out of temperature control during preparation, inadequate initial cooking, improper hot or cold holding, improper cooling, and cross-contamination. These findings suggest that audit observations involving raw animal foods, inadequate cooking, poor cooling, temperature abuse, and cross-contamination should be treated as a connected bacterial outbreak pathway (i.e., a contributing factors cluster), not as separate technical infractions.
For viral outbreaks, the predictive pattern is different. Viruses do not grow in food, so proliferation and survival factors do not apply in the same way. The dominant viral pathway is contamination by an infectious food worker. In the CDC data, contamination from infectious workers through bare-hand, gloved-hand, or unknown hand contact accounted for the leading viral outbreak contributing factors across the study period. This means audit findings related to employee illness reporting, exclusion and restriction policies, hand hygiene, glove use, bare-hand contact with ready-to-eat (RTE) foods, and managerial enforcement (e.g., lack of exclusion of sick employees or return-to-work policy execution) should be interpreted as part of a viral contamination pathway. A clean temperature log does not offset the risk created by an ill employee handling RTE food.
"CDC notes that outbreak-associated illnesses represent only a small proportion of all foodborne illnesses, meaning that the same operational failures identified in outbreaks may also be contributing to sporadic illnesses that are never linked to a recognized event."
For risk-based intelligence, the practical conclusion is that contributing factor clusters can be used as outbreak pathway indicators. They are not precise predictors in the actuarial sense because the CDC data describe investigated outbreaks, not the denominator of all restaurant operations or all inspection findings. However, they are highly informative for prioritizing risk. Findings that map to repeatedly observed outbreak contributing factors should receive greater weight than findings with weak or indirect links to illness causation. Even more importantly, findings should be evaluated in clusters. A single missing thermometer is one concern, but missing thermometer use, cooling foods in deep containers, inadequate cooling logs, and observed improper cold holding together create a proliferation pathway. Likewise, cross-contamination arises not from a single cutting board issue, but from the combination of raw poultry handling, poor handwashing, shared utensils, and RTE food assembly.
Contributing Factors May Also Predict Sporadic Foodborne Illness Pathways
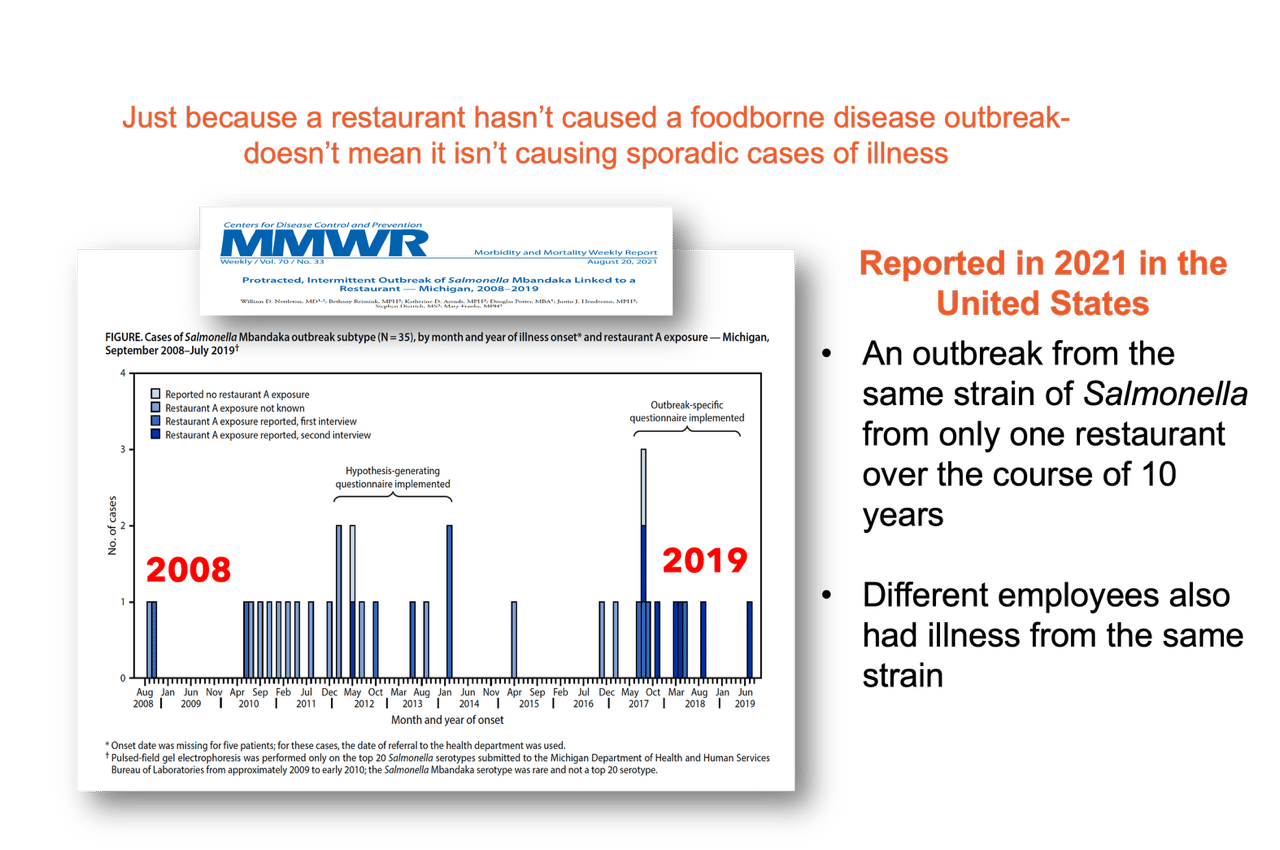
CDC also notes that outbreak-associated illnesses represent only a small proportion of all foodborne illnesses, meaning that the same operational failures identified in outbreaks may also be contributing to sporadic illnesses that are never linked to a recognized event. A Salmonella Mbandaka outbreak linked to a Michigan restaurant is an important example of why restaurant food safety risk cannot be fully understood through a single inspection, a single complaint, or even a single confirmed case. Public health officials ultimately determined that one restaurant was associated with a protracted, intermittent outbreak that occurred over an 11-year period, from 2008–201912 (Figure 2). Thirty-six infected persons were identified with highly related isolates by pulsed-field gel electrophoresis (PFGE) and whole genome sequencing, but the source was not recognized for years because the cases appeared sporadically, patient food histories were incomplete, and early interviews focused more on food items than on food establishments. Only after repeated case interviews, an outbreak-specific questionnaire, environmental sampling, employee stool testing, and molecular subtyping did the restaurant source become clear. The investigation found the outbreak strain not only in ill customers, but also in asymptomatic food workers and throughout the restaurant environment, including cooking, preparation, dishwashing, storage, and employee restroom areas.
FIGURE 2. Cases of Salmonella Mbandaka Linked to a Michigan Restaurant (Credit: CDC)
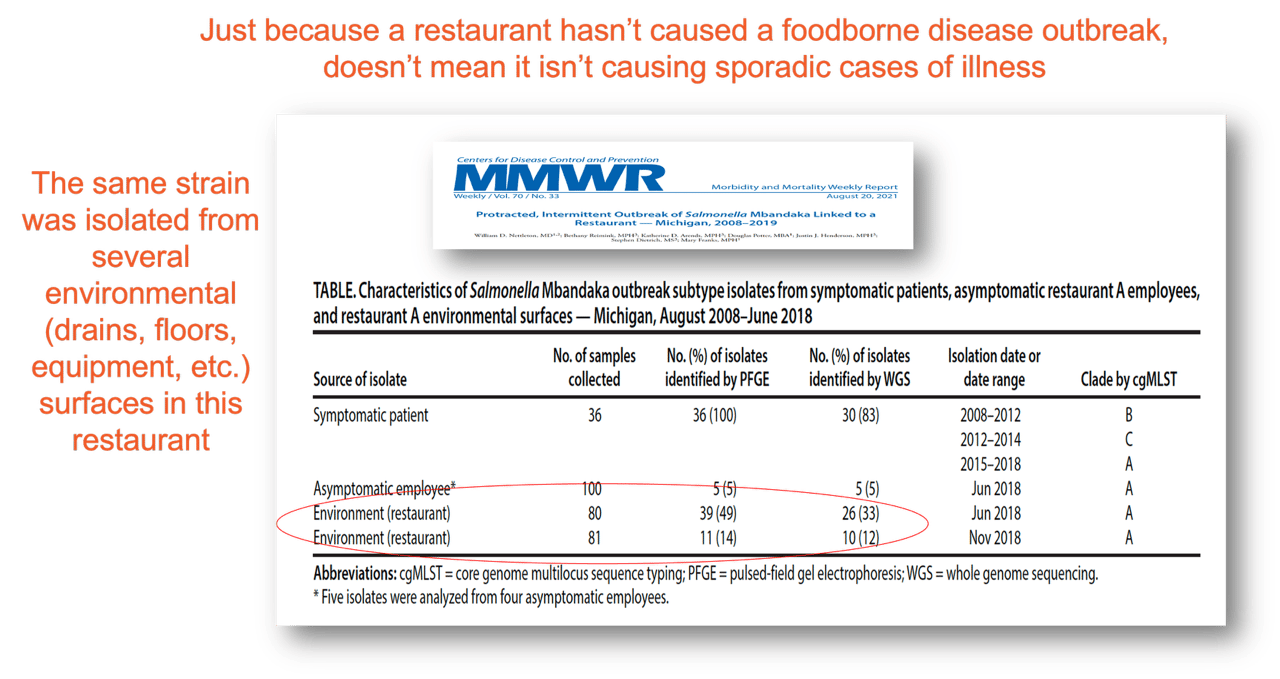
This outbreak has direct relevance to the problem of undetected cross-contamination and poor sanitation in restaurants. Salmonella was isolated from 39 of 80 environmental samples (Figure 3) during the first round of environmental testing and from 11 of 81 samples during a second round, despite renovations and enhanced cleaning. The organism was recovered from multiple areas of the facility, suggesting that the restaurant environment itself had become part of the transmission pathway. In practical restaurant terms, this is the kind of failure that may not be visible as a single event during a routine audit. A cutting board, drain, floor area, dishwashing zone, employee restroom, storage area, or piece of equipment may contribute to intermittent contamination without producing an obvious, immediate outbreak signal. Customers may experience illness as isolated, sporadic cases; some may not seek medical care, some may not be tested, and some may not remember or report the restaurant exposure. In this way, poor sanitation and environmental persistence can produce a series of apparently unrelated illnesses until molecular surveillance and environmental investigation finally connect the cases.
FIGURE 3. Characteristics of Salmonella Mbandaka Outbreak Subtype Isolates From Patients, Restaurant Employees, and Surfaces (Credit: CDC)
The lesson for restaurant audits is that the highest-risk sanitation failures are not always captured by whether the facility appears clean at the time of inspection or whether a checklist item is marked compliant. What matters is whether the restaurant has conditions that allow a pathogen to persist, move, and periodically contaminate food or food-contact surfaces.
In the Michigan investigation, routine inspections and administrative hearings had already identified cleanliness, maintenance, lack of active managerial control, and other foodborne illness risk factors before the outbreak source was fully confirmed. Yet those findings did not translate into sustained control. This is exactly where a contributing factor-based risk intelligence model could add value. Rather than treating sanitation, employee health, equipment condition, pest control, dishwashing, and corrective action failures as separate audit categories, the model would interpret them together as a possible contamination pathway. When combined with customer complaints, repeat violations, employee illness indicators, environmental history, and regional case surveillance, this type of overlay could help identify restaurants where cross-contamination and poor sanitation are creating sporadic illness risk and/or foodborne illness outbreak risk before the pattern becomes visible through confirmed cases.
This approach changes the purpose of an audit. The goal is not simply to count violations; it is to identify whether the facility has active combinations of conditions that resemble known outbreak pathways. The highest-risk groups of contributing factors are those that connect contamination, proliferation, and survival in ways that make illness biologically plausible. Audits that classify findings into these pathway clusters can better distinguish routine noncompliance from conditions that are more likely to cause a foodborne illness outbreak.
Rebuilding Third-Party Audit Data Around Contributing Factors
A third-party audit program can be converted into a more useful risk intelligence model by reorganizing the data around outbreak contributing factors, rather than treating each audit question as a standalone compliance item.
Mapping Relevant Audit Questions
The first step is to map each relevant audit question to one or more recognized outbreak pathways: contamination, proliferation, or survival. This allows the audit data to show not only what failed, but how that failure could contribute to foodborne illness:
- Contamination: Examples include ill food workers, bare-hand contact, cross-contamination, contaminated equipment, environmental contamination, and supplier/preparation contamination
- Proliferation: Examples include cooling failures, cold holding failures, hot holding failures, prolonged time out of temperature control, and extended storage
- Survival: Examples include inadequate cooking, inadequate reheating, and ineffective thermal or nonthermal processes.
Some questions may not map strongly to outbreak causation. Those questions can remain part of brand-standard compliance, but should not drive the outbreak risk model. For example, each failed audit item can be coded into one or more of these contributing factor clusters shown in Table 2.
TABLE 2. Coding Failed Audit Items Into Contributing Factor Clusters (Credit: H. King)
Examining the Audit Data
Once audit questions are mapped to contributing factors, then the data can be examined for pathway clusters. A single failed item may represent an isolated lapse, but multiple related findings within the same causal pathway may indicate a more meaningful outbreak risk condition. For example, contamination risk becomes more significant when a pathogen source, a transfer route, a food vehicle, and a control failure are present in the same operation. Likewise, proliferation risk becomes more concerning when time/temperature abuse occurs in combination with weak monitoring, lack of corrective action, and food held for future service. Survival risk is elevated when cooking or reheating failures occur alongside poor thermometer use, missing corrective action, or service to high-risk populations.
An example high-risk contamination cluster could look like the following:
- Pathogen source exists: Ill employee or raw animal food
- Transfer route exists: Hands, utensils, cutting board, food-contact surface
- Food vehicle exists: RTE food or inadequately cooked food
- Control failure exists: Poor handwashing, sanitizer failure, or no separation.
An example high-risk proliferation cluster could look like the following:
- Time/temperature control for safety (TCS) food present
- Time/temperature abuse occurs
- Monitoring is absent
- Corrective action is absent
- Food is held for future service.
An example high-risk survival cluster could look like the following:
- Raw or under-processed food present
- Cooking/reheating standard not met
- Thermometer inaccurate or not used
- Corrective action not taken
- Food served to high-risk population.
In this way, the model shifts the purpose of audit data from identifying individual violations to identifying combinations of conditions that resemble known outbreak pathways.
Enriching the Data
The next step is to enrich the audit data with context that helps distinguish lower-significance findings from conditions more closely associated with outbreak causation. Instead of only weighting the third-party audit by critical/major/minor findings, weight by:
- Strength of association with known outbreak contributing factors cluster
- Whether the violation is active at the time of other audits (e.g., internal or field staff audits)
- Whether the failure affects RTE foods
- Whether the failure involves high-risk foods or high-risk populations
- Whether the finding is repeated
- Whether multiple failures occur in the same causal pathway.
A single cold holding deviation may matter. However, a cold holding failure plus inadequate cooling logs plus poor corrective action verification is more meaningful because it suggests a proliferation control system failure. The goal is not simply to categorize findings as critical, major, or minor, but to determine whether the finding has outbreak relevance and whether it is occurring alongside other related failures.
Reoccurrence is especially important because repeated findings may indicate a management system weakness rather than a one-time error. A repeated critical violation, the same contributing-factor pathway appearing over multiple assessments data (field staff audits, internal audits, etc.), corrective actions that are documented but not sustained, or similar patterns across multiple stores or markets can all signal persistent risk. For example:
- Same critical violation in two or more consecutive assessments (e.g., field staff or internal audit, health inspection audit, monitoring technology, etc.)
- Same contributing factor pathway in two or more assessments
- Same manager or shift associated with repeated failures
- Corrective action documented but not sustained
- Recurring violations across multiple stores in the same market.
When viewed this way, quarterly audit data becomes a longitudinal source of intelligence that can help separate isolated noncompliance from recurring system failure. It allows brands to distinguish between an isolated miss and a systemic risk pattern.
"Third-party audit data is only one part of a more complete risk intelligence model. The next stage is to integrate these audit-derived contributing factor pathways with other operational and public health signals."
Designing a Risk Intelligence Model
The final output of this approach is the beginning of a risk intelligence model that supports decision-making. Instead of relying only on a pass/fail score or aggregate audit percentage, the organization can use the mapped data to identify where contamination, proliferation, or survival pathways are forming, recurring, or escalating. This creates a more actionable view of food safety risk: routine corrections can address isolated findings, targeted coaching can address moderate pathway concerns, management review can focus on locations with clustered findings, and immediate intervention can be reserved for combinations of conditions that resemble an imminent outbreak pathway.
The specific method for calculating or scoring these results can be determined by each organization, but the underlying structure should allow third-party audit data to reveal outbreak-relevant patterns that traditional audit scoring may miss. Possible decision tiers are shown in Table 3.
TABLE 3. Possible Tiers for Decision-Making Using Data From Audit Failures (Credit: H. King)
Practical Tools for Identifying and Evaluating Risk Accurately
- Risk Matrix or Heat Map
Visually plots the probability (likelihood) of an event against its severity (impact). Helps prioritize risks across facilities, systems, or processes. - Failure Mode and Effects Analysis (FMEA)
Systematically evaluates where and how processes could fail, and the consequences if they do. Assigns numerical scores for occurrence, severity, and detection to calculate a risk priority number (RPN). - Historical Incident Data and Complaint Trends
Using actual plant-level or industry-wide data on past recalls, deviations, and consumer complaints can reveal systemic weak points and predict future risk areas. - Environmental Monitoring and Sanitation Validation Data
Provides real-time risk indicators, especially for microbial and allergenic threats, which can be tied to operational decisions (e.g., infrastructure upgrades, cleaning frequencies). - Near-Miss and CAPA Tracking
Formalizes tracking of how near-misses are logged and investigated, while CAPA tracking can expose underestimated or recurring risks that have not yet resulted in a failure, but could. - Insurance Risk Assessments and Underwriter Feedback
Leverage insurer-provided assessments and audit services. These often offer third-party validation of risk exposure from a financial and liability standpoint. - Competitive Failure Benchmarking
Evaluate public recall data and case studies from companies in your category. Understanding how peers have failed—and what it cost them—adds context and credibility to internal ROI arguments.
Takeaway
The immediate opportunity is to stop under-using the third-party audit data that foodservice organizations already collect. These audits contain far more value than a pass/fail result, a numerical score, or a list of corrective actions. When audit findings are mapped to known outbreak contributing factors and then evaluated as contamination, proliferation, and survival pathways, they can begin to reveal whether a restaurant is simply out of compliance or whether it is showing early signs of an outbreak pathway that requires intervention.
This first step does not require a fully automated artificial intelligence (AI) platform. It requires a different way of organizing and interpreting the data already being produced. By rebuilding audit results around outbreak causation, brands can begin to distinguish isolated violations from recurring system weaknesses, identify clusters of findings that are more meaningful than individual deficiencies, and focus leadership attention on the conditions most likely to result in foodborne illness.
However, third-party audit data is only one part of a more complete risk intelligence model. The next stage is to integrate these audit-derived contributing factor pathways with other operational and public health signals, including but not limited to: inspection history, employee illness trends, staffing patterns, temperature monitoring data, customer complaints, supply chain disruptions, prior outbreak history, and local illness activity. When these data streams are connected and AI is applied appropriately, the industry can move closer to predictive food safety management: identifying where contamination, proliferation, or survival pathways are at higher risk before an outbreak occurs.
This is where the future of food safety risk intelligence must go. Third-party audits can provide the starting structure, but the larger opportunity is to build systems that continuously analyze multiple signals, recognize emerging outbreak pathways, and support faster, more precise preventive action. In future articles, the author will examine how AI, data integration, and predictive analytics can be used to expand this contributing factor framework into a more complete enterprise risk intelligence model for foodservice operations.
Funding Acknowledgment Statement
This article was supported by the U.S. Food and Drug Administration (FDA) of the U.S. Department of Health and Human Services (HHS) as part of a financial assistance award (FAIN) totaling $500,000, with 100 percent of this article funded by FDA/HHS. The contents are those of the authors and do not necessarily represent the official views of, nor an endorsement by, FDA/HHS or the U.S. government.
References
- Bricher, J.L. "Expert Q&A: AI & Food Safety—Getting the Data Right." Food Technology Magazine. Institute of Food Technologists (IFT). https://www.ift.org/food-technology-magazine/getting-the-data-right.
- King, H. Food Safety Management Systems: Achieving Active Managerial Control of Foodborne Illness Risk Factors in a Retail Food Service Business. Springer Nature, 2020. https://link.springer.com/book/10.1007/978-3-030-44735-9.
- Irwin, K., J. Ballard, J. Grendon, and J. Kobayashi. "Results of Routine Restaurant Inspections Can Predict Outbreaks of Foodborne Illness: The Seattle–King Country Experience." American Journal of Public Health. (May 1989). https://ajph.aphapublications.org/doi/epdf/10.2105/AJPH.79.5.586.
- Wang, H., W. Cui, Y. Guo, Y. Du, and Y. Zhou. "Machine Learning Prediction of Foodborne Disease Pathogens: Algorithm Development and Validation Study." JMIR Medical Informatics 9, no. 1 (January 2021). https://medinform.jmir.org/2021/1/e24924/.
- Sadilek, A., S. Caty, L. DiPrete, et al. "Machine-Learned Epidemiology: Real-Time Detection of Foodborne Illness at Scale." NPJ Digital Medicine 1, no. 36 (November 2018). https://www.nature.com/articles/s41746-018-0045-1.
- Sari, O.F., M. Bader-El-Den, and V. Ince. "Explainable Transformer-Based Modelling for Pathogen-Oriented Food Safety Inspection Grade Prediction Using New York State Open Data." Foods 15, no. 2 (January 2026). https://doi.org/10.3390/foods15020223.
- Holst, M.M., B.C. Wittry, C. Crisp, et al. "Contributing Factors of Foodborne Illness Outbreaks—National Outbreak Reporting System, United States, 2014–2022." U.S. Centers for Disease Control and Prevention (CDC). Morbidity and Mortality Weekly Report 74, no. 1 (March 13, 2025): 1–12. https://www.cdc.gov/mmwr/volumes/74/ss/ss7401a1.htm.
- CDC. "Restaurant Food Safety: Contributing Factor Definitions." April 25, 2024. https://www.cdc.gov/restaurant-food-safety/php/investigations/cf-definitions.html.
- CDC. "Restaurant Food Safety: Contamination Contributing Factors." April 22, 2024. https://www.cdc.gov/restaurant-food-safety/php/investigations/contamination-cfs.html.
- CDC. "Restaurant Food Safety: Proliferation Contributing Factors." April 22, 2024. https://www.cdc.gov/restaurant-food-safety/php/investigations/proliferation-cfs.html
- CDC. "Restaurant Food Safety: Survival Contributing Factors." April 22, 2024. https://www.cdc.gov/restaurant-food-safety/php/investigations/survival-cfs.html
- Nettleton, W.D., B. Reimink, K.D. Arends, et al. "Protracted, Intermittent Outbreak of Salmonella Mbandaka Linked to a Restaurant—Michigan, 2008–2019." CDC. Morbidity and Mortality Weekly Report 70, no. 33 (August 20, 2021): 1109–1113. https://www.cdc.gov/mmwr/volumes/70/wr/mm7033a1.htm.
Hal King, Ph.D. is Managing Partner of Active Food Safety LLC and a member of the Editorial Advisory Board of Food Safety Magazine. He is a public health professional who has worked in the investigation of respiratory, foodborne, and other disease outbreaks at the CDC; performed federally funded research on the causation and prevention of infectious diseases at Emory University School of Medicine's Division of Infectious Diseases; and worked in the prevention of intentional adulteration of foods and food defense with the U.S. Army Reserves Consequence Management Unit. Dr. King was formerly the Director of Food and Product Safety at Chick-fil-A Inc., and is the author of several frequently cited books on food safety management and food safety business leadership. Dr. King is also the recipient of the 2018 NSF International Food Safety Leadership and Innovation Award.